
Polynomial-Regression-based-on-Deep-Learning-in-Matlab
Polynomial-Regression-based-on-Deep-Learning-in-Matlab
Polynomial Regression based on Deep Learning in Matlab
Review from Client ->
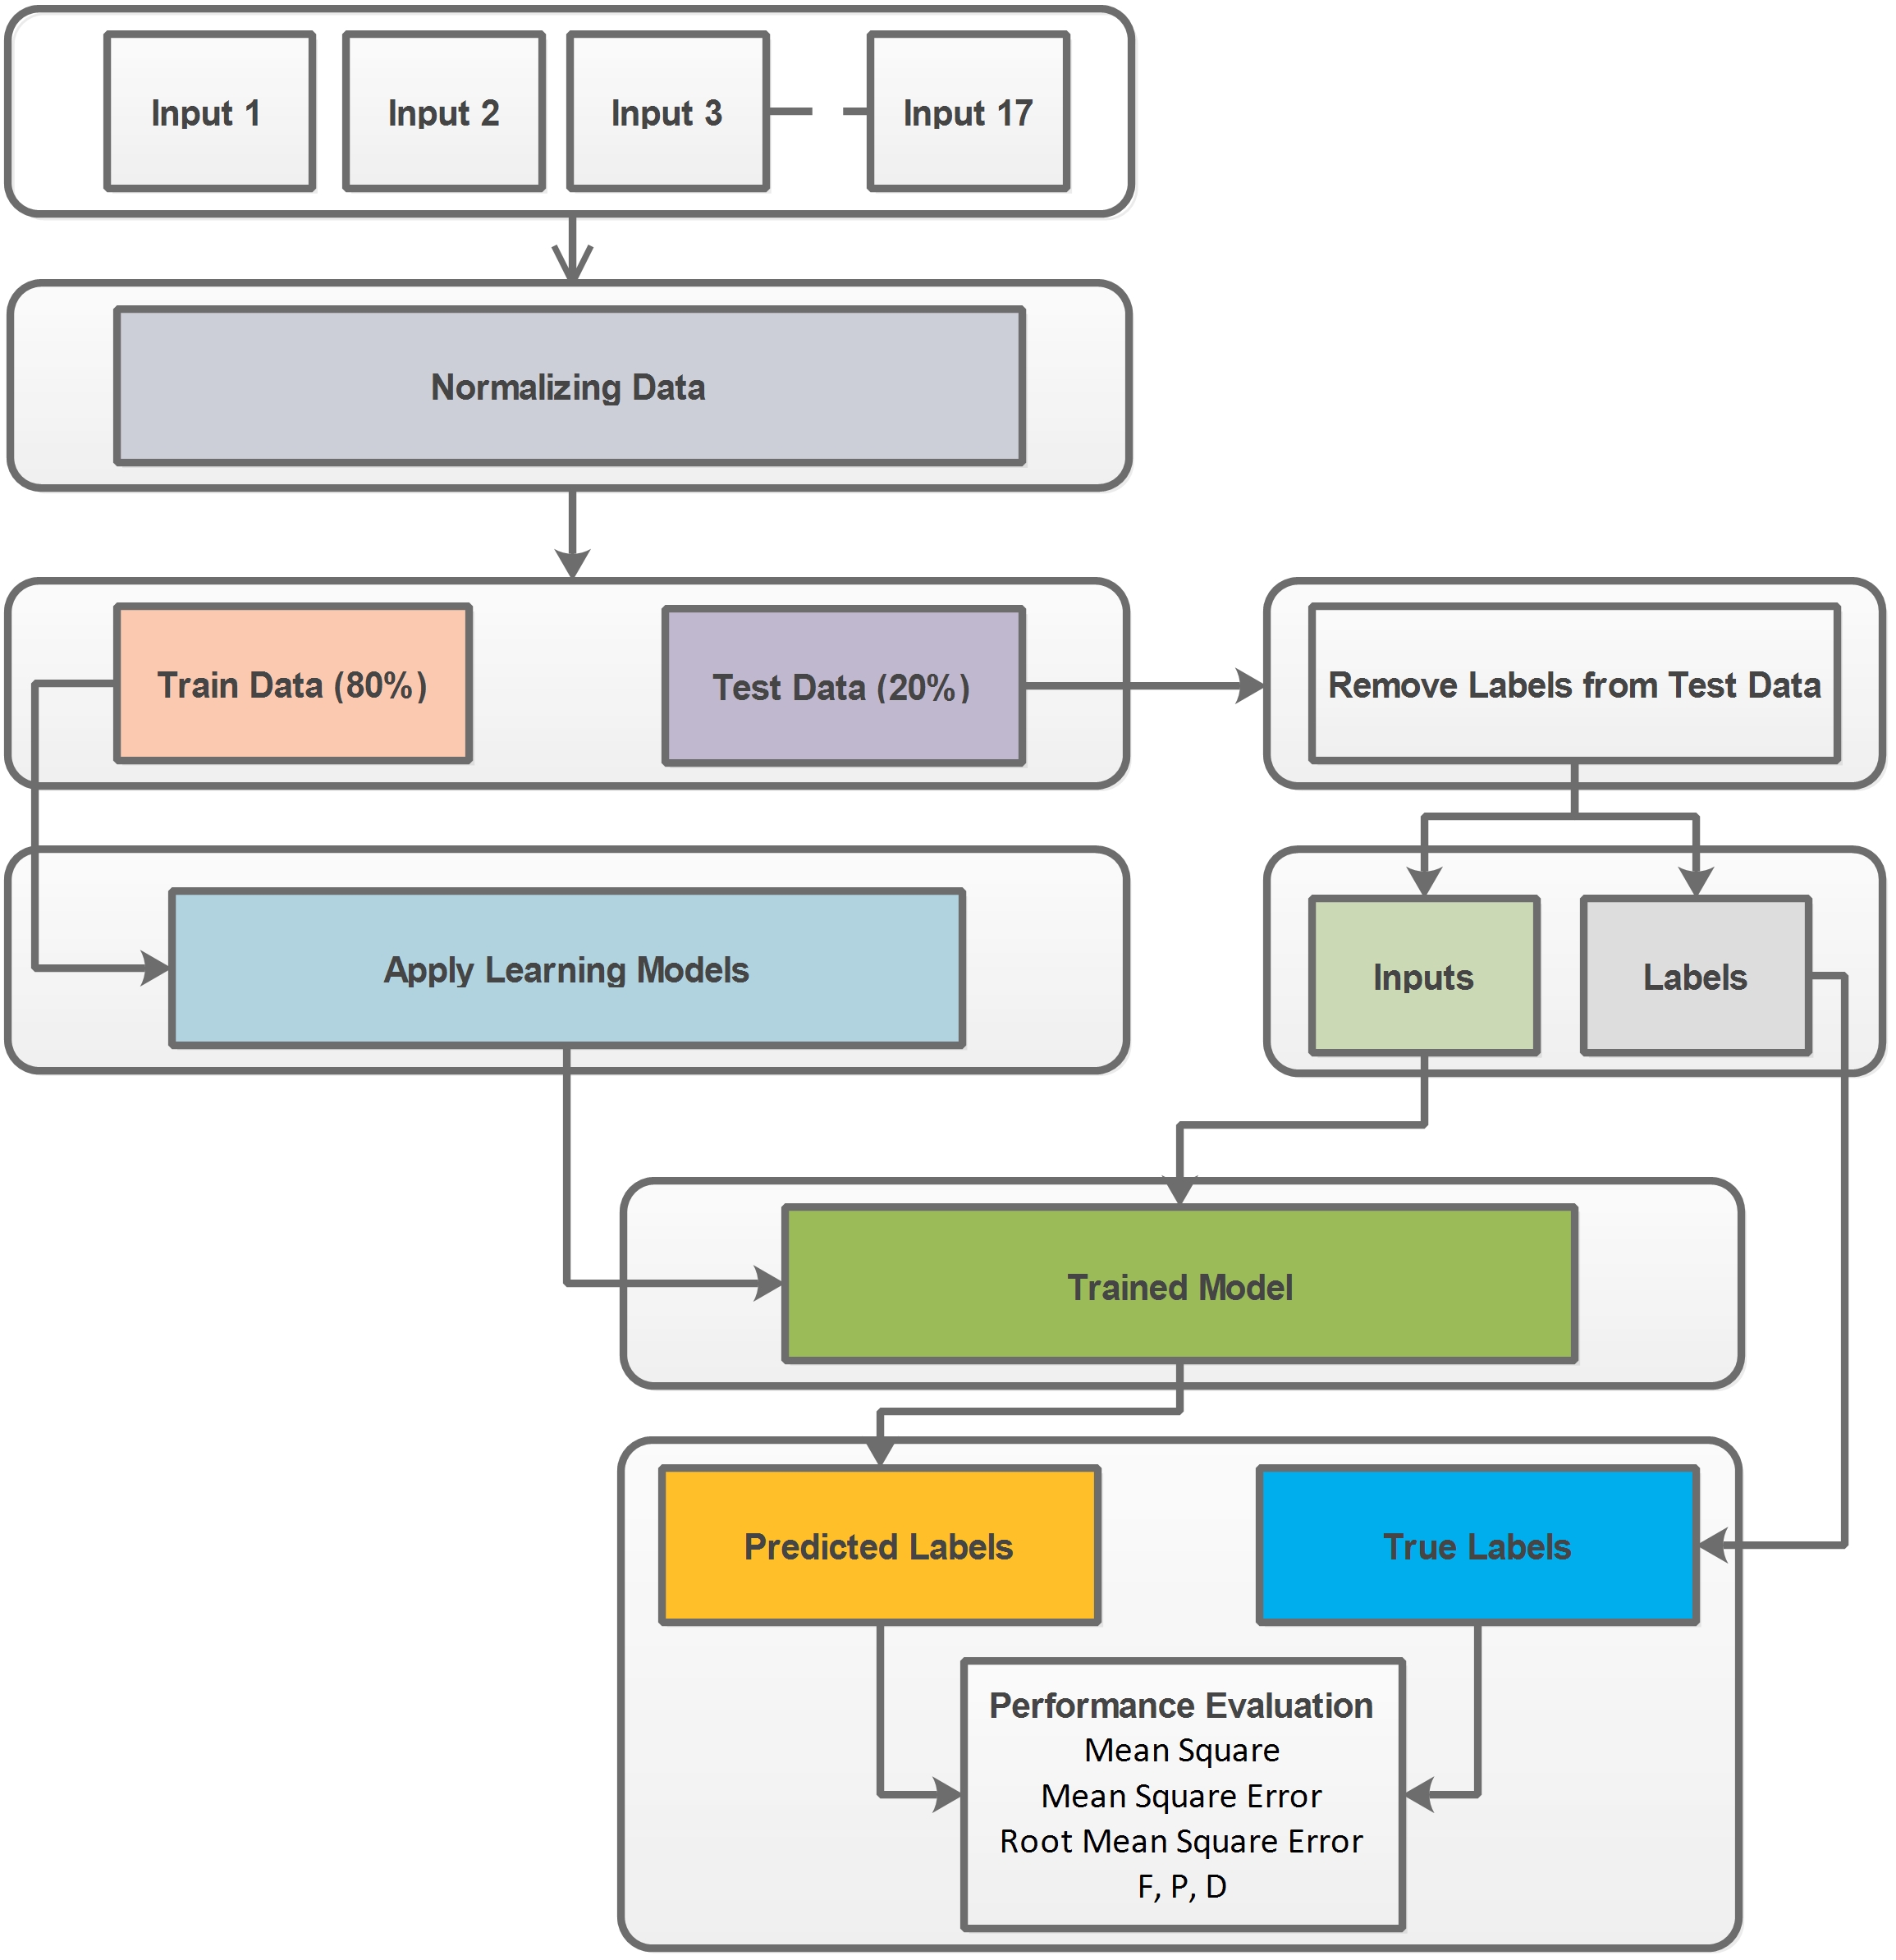
Proposed Methodology:
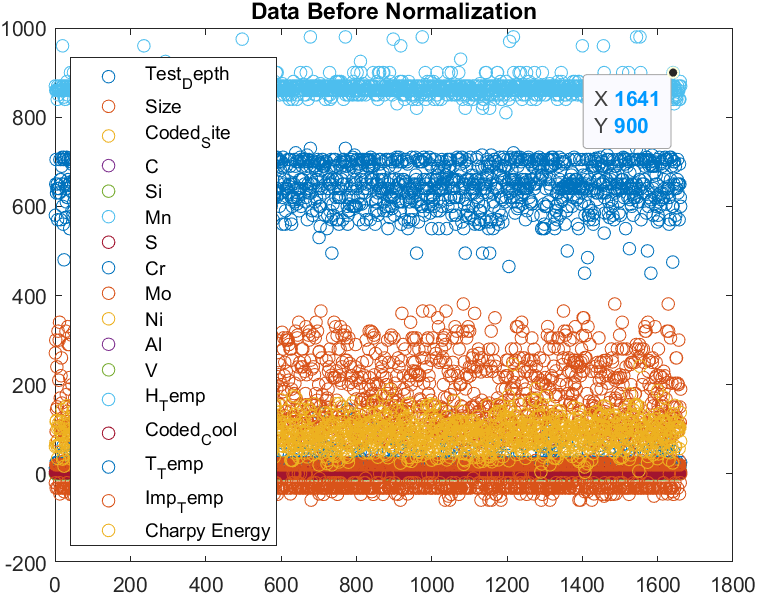
Data Before Normalization
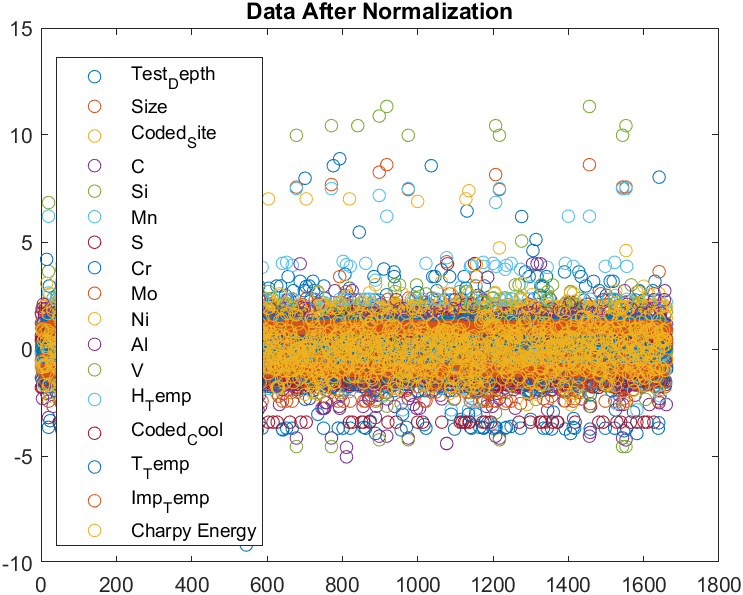
Data After Normalization
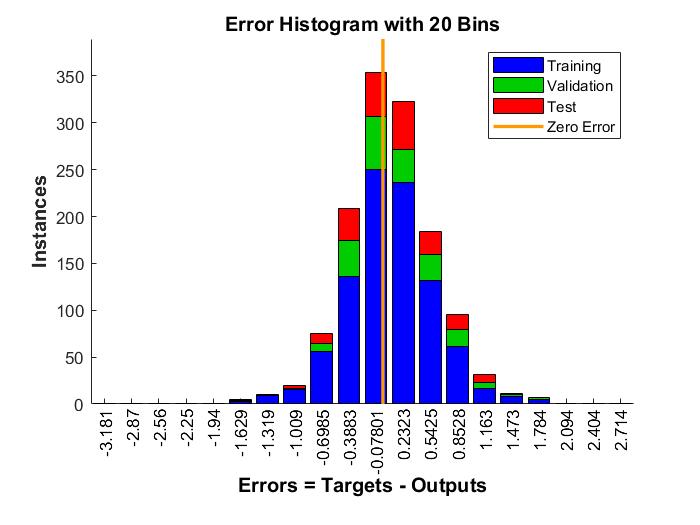
Error Histogram
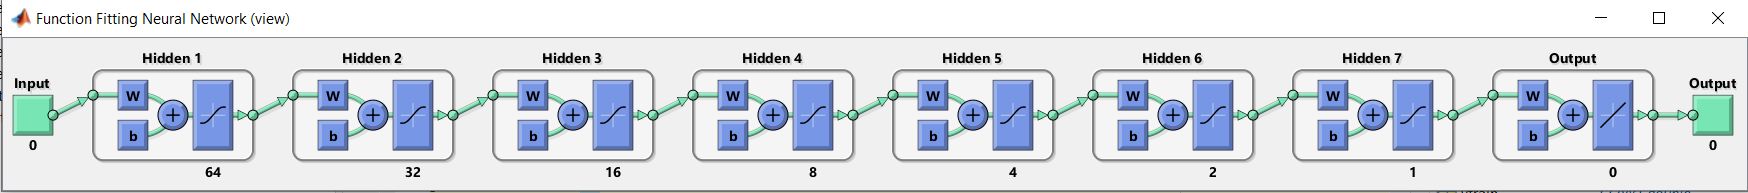
Learning Curve
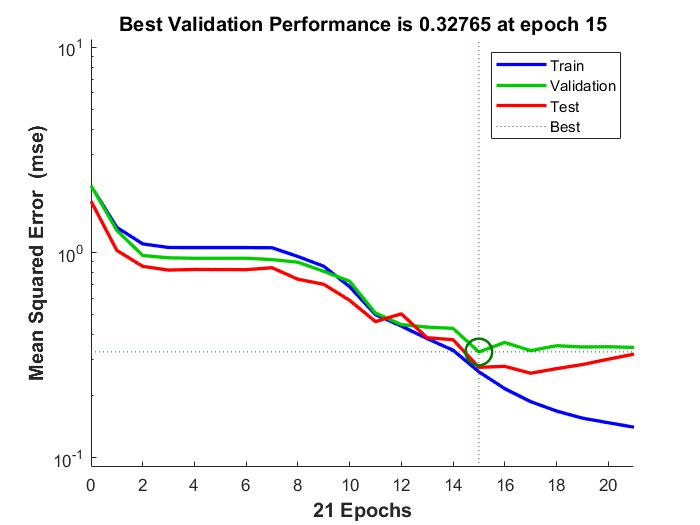
Thisgraph is showng that we have total 21 epochs used and from which we have lowest MSE at epoch no 15 which was 0.32, learning curves for training validation and testing are shown in graphs by blue, green and red respectively.
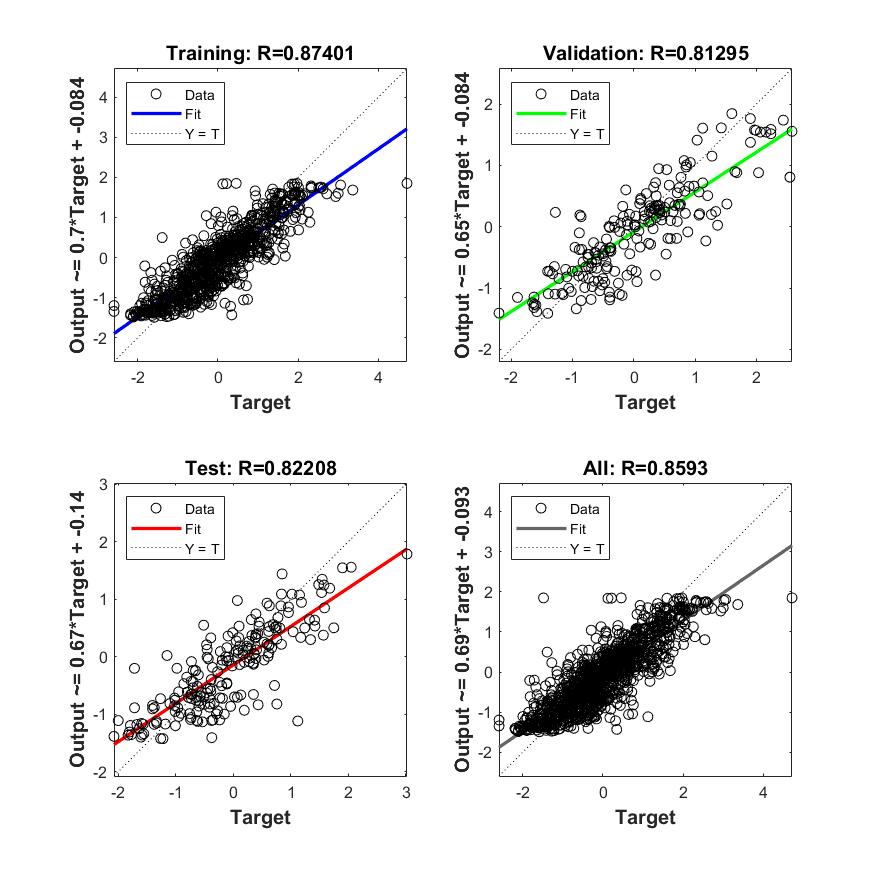
MLR
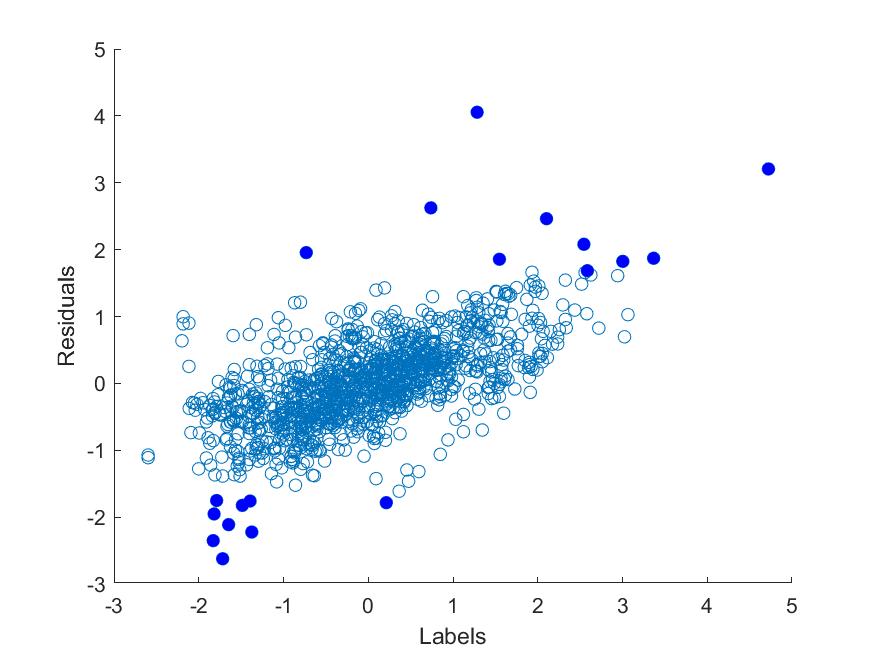 This graph is showing the results for line fitting for training, validation and testing of MLP.
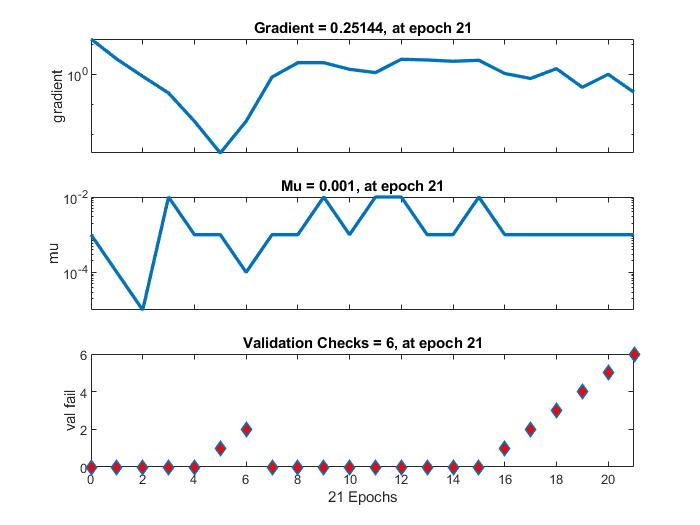
Train State
This graph is showing the results of gradient, mu, and val fail for each epoch