An Artificial Intelligence Based Automatic Detection of Veins Blockage
An Artificial Intelligence Based Automatic Detection of Veins Blockage
Demo ->
Introduction
- Blockage in the veins, a very common disease
- Can cause heart attack or angina
- Continuous blockages can burst
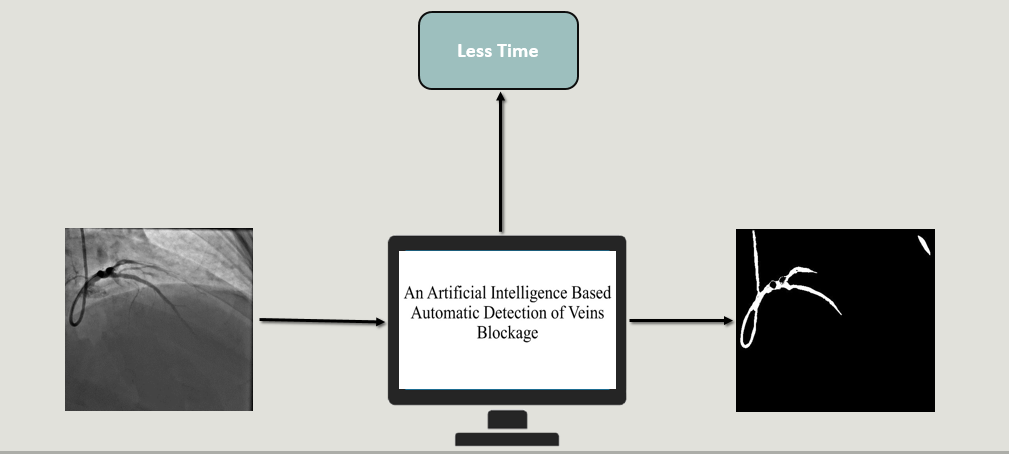
- Common remedy is an angiography in which doctors repair the veins by inserting stents known as angioplasty.
Proposed System
The Proposed system will mainly follow through four main step and some of sub-steps in them
- Image Acquisition
- Pre-Processing
- Histogram Equalization
- Edge Detection
- Colour Transformation
- Plaque Identification
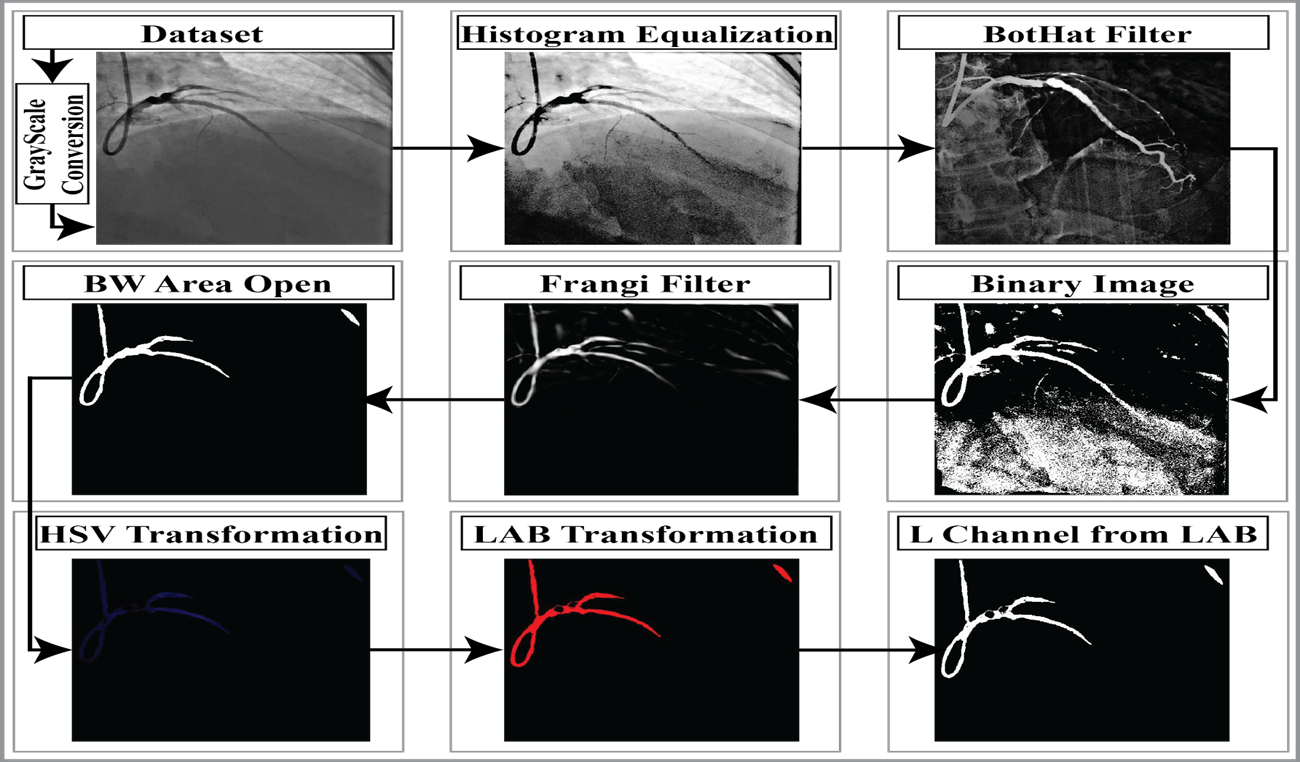
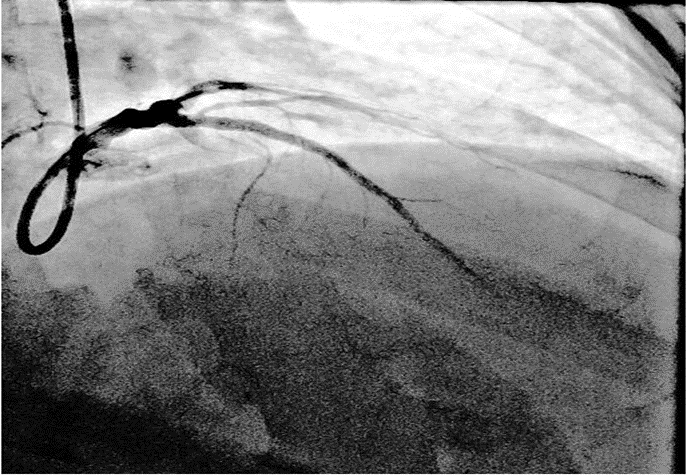
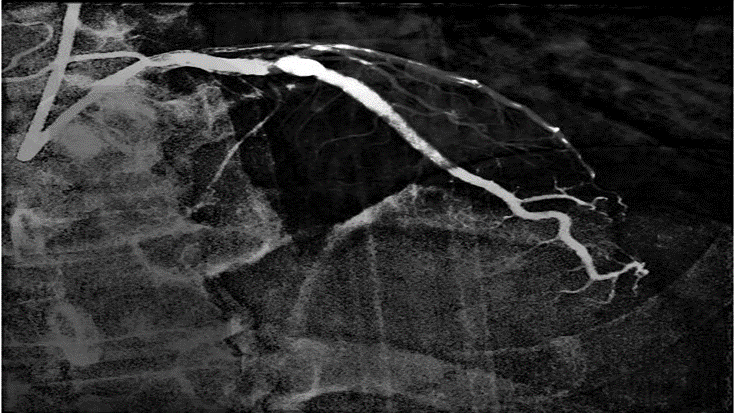
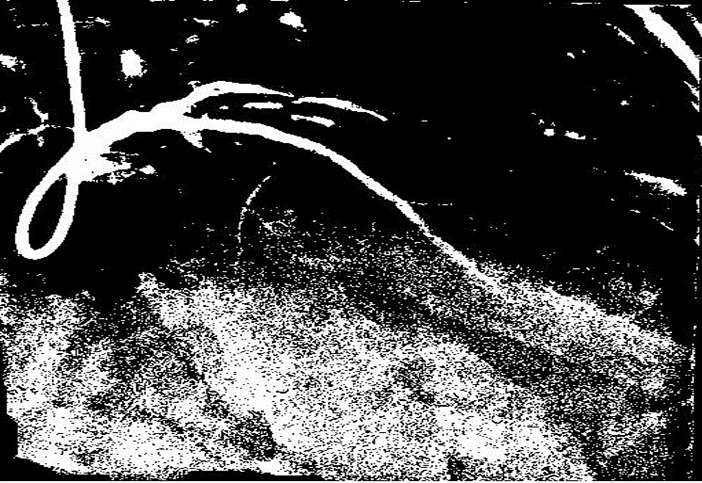
Image Acquisition: Acquire an angiographic image
Grey Scale Conversion of the angiographic image to arrange fewer data for each pixel
Grey Scale Image (also called grey-level) is a data matrix whose values represent intensities within some range.
Equation: 𝟎.𝟐𝟗𝟖𝟗 ∗ 𝐑 + 𝟎.𝟓𝟖𝟕𝟎 ∗ 𝐆 + 𝟎.𝟏𝟏𝟒𝟎 ∗ 𝐁
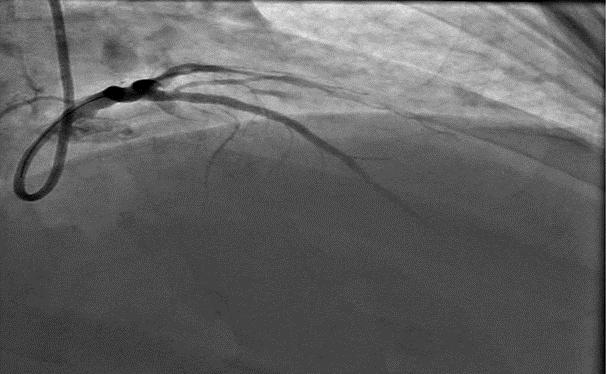
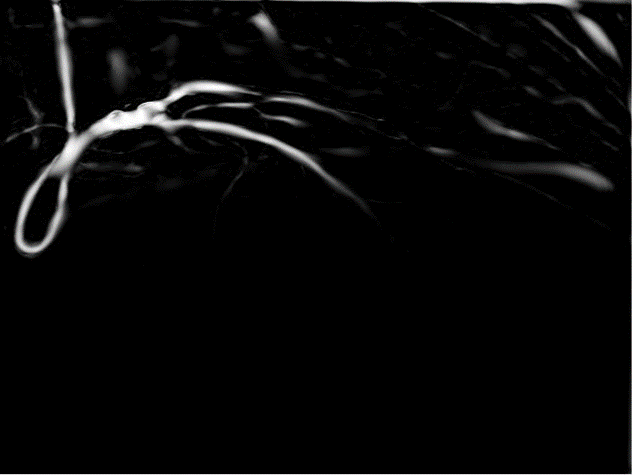
Image Magnification through Equalized histogram technique Equalized histogram: The process of adjusting intensity values can be done automatically using histogram equalization. Algorithm: For each pixel of the image value = Intensity(pixel) histogram(value)++ end
Edge Detection through the following techniques: Bot-hat Filter computes the morphological closing of the image and then subtracts the original image from the result Equation: IMGBH=(A.B)−A
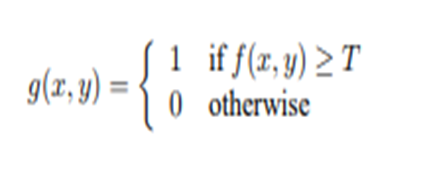
Binary image is a digital image that has only two possible values for each pixel. each pixel is stored as a single bit—i.e., a 0 or 1
Equation: 𝒈(𝑿,𝒀)={𝟏
Edge Detection (Cont..) Firangi filter uses the eigen vectors of the Hessian to compute the likeliness of an image region to vessels, according to the method described by Firangi. Equation: 
Edge Detection (Cont..) Equation: 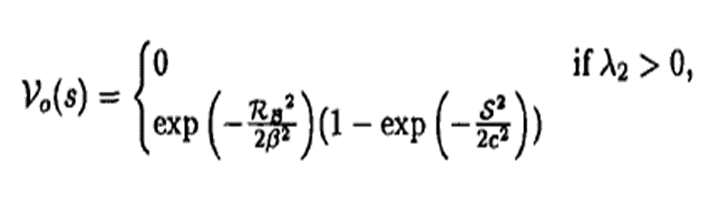
Where; ⅄2 will be the eigenvalue ℛꞵ and S are the line filters ꞵ and C are the threshold values
Edge Detection (Cont..) Area Opening: The system removes from a binary image all connected components (objects) that have fewer than P pixels, producing another binary image BW2 Syntax: BW2 = BWAREAOPEN(BW,P)

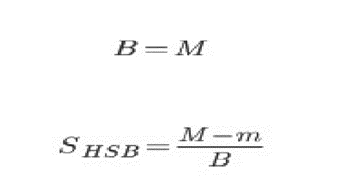
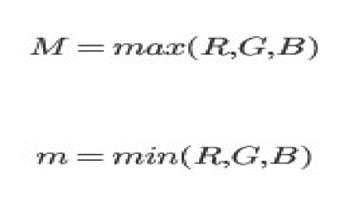
Colour coding through the following colour schemes: HSV Transformation: HSV is alternative representations of the RGB colour model. H stands for Hue, S stands for Saturation and the V for Value. Hue is usually a number between 0 and 360 that represents the angle in the colour wheel Saturation is expressed in a range from just 0–1, where 0 is grey and 1 is a primary colour. Value describes the brightness or intensity of the colour, from 0–100 percent, where 0 is completely black, and 100 is the brightest Colour coding (Cont..) HSV Transformation (Cont..) Equation:
Where:

LAB Transformation The CIELAB colour space is also known as CIE Lab* or sometimes abbreviated as simply “Lab” colour space It expresses colour as three numerical values, L* for the lightness and a* and b* for the green–red and blue–yellow colour components Syntax: lab = rgb2lab(rgb)

LAB’s L Component output Display the L* component of the Lab* image Syntax: imshow(lab(:,:,1)

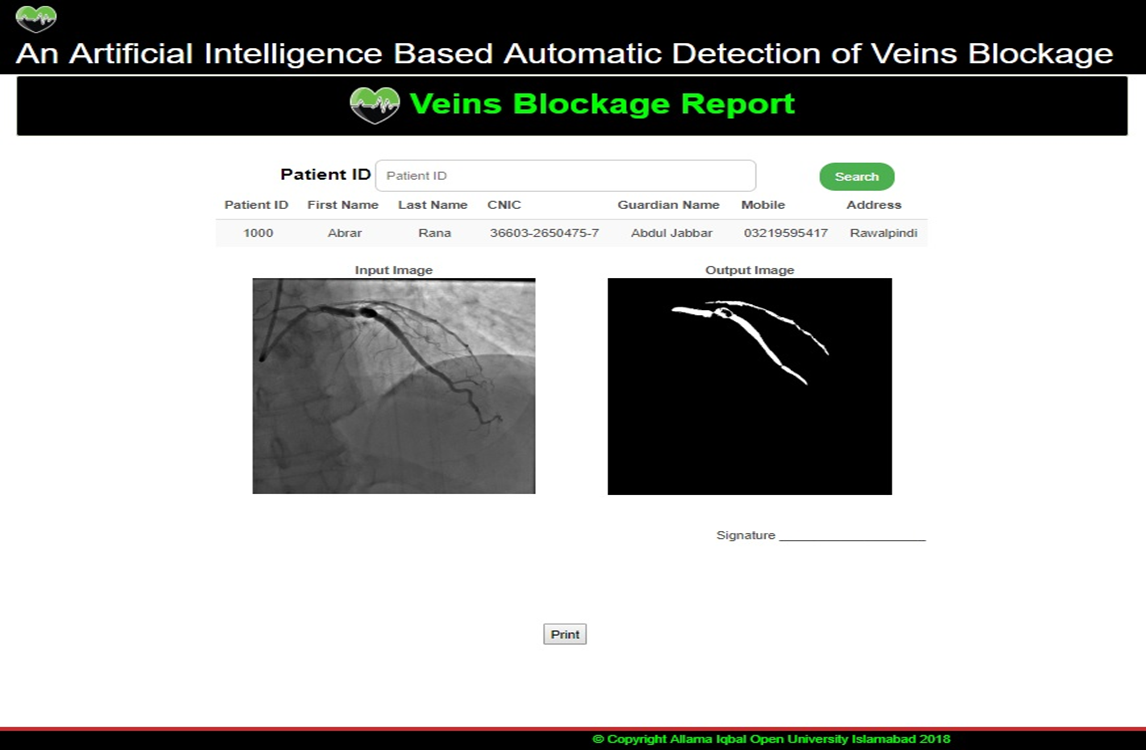
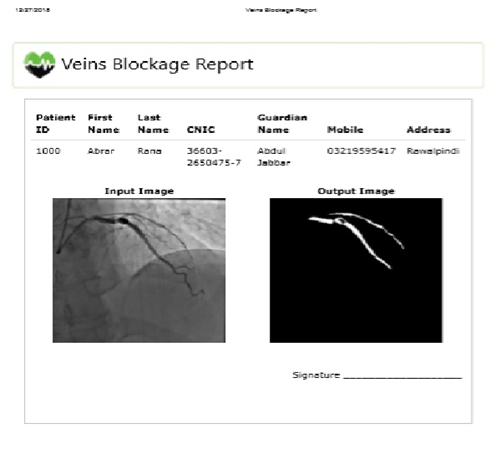
Generate Report The angiographic image will be processed in MATLAB and PHP application will generate the report
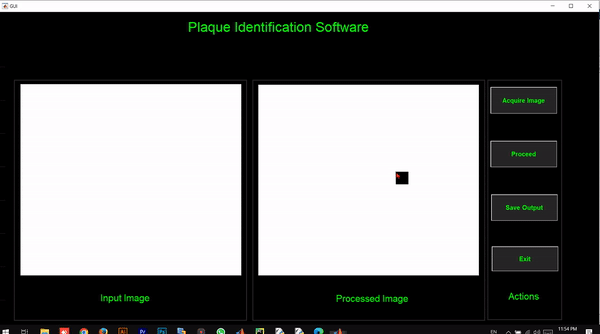
User Interface 1
User Interface II
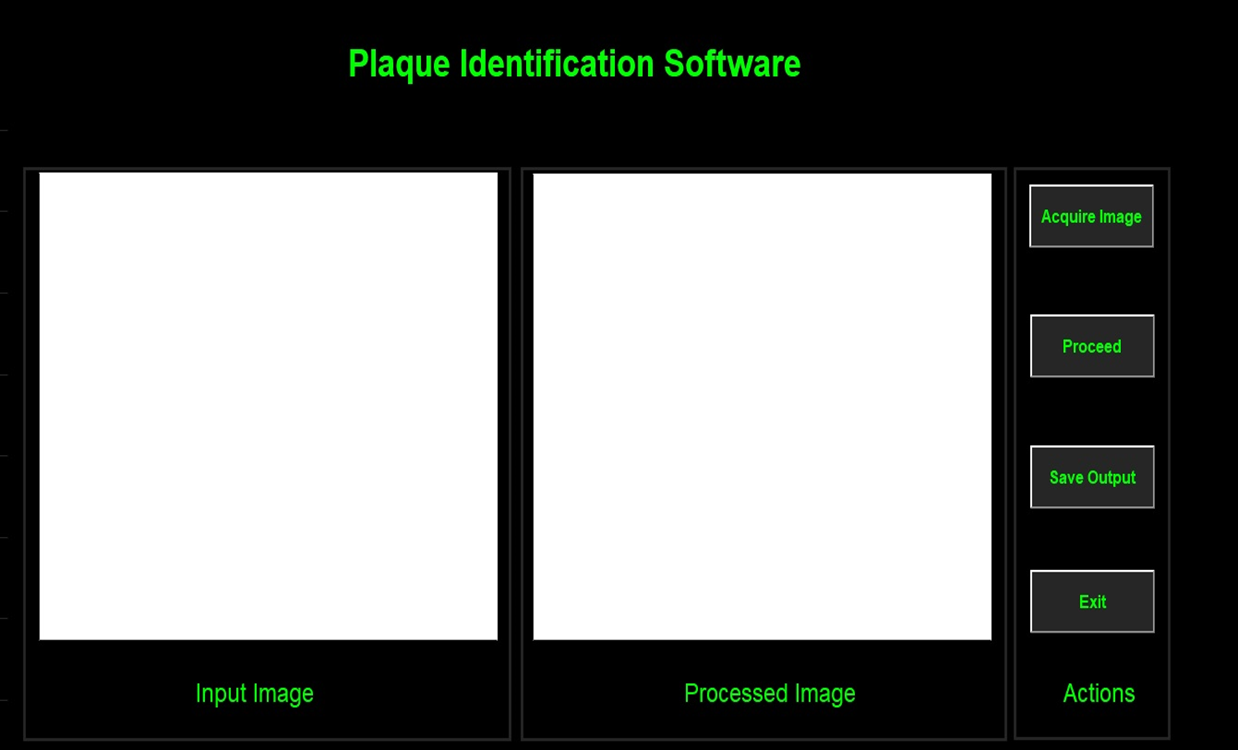
User Interface III
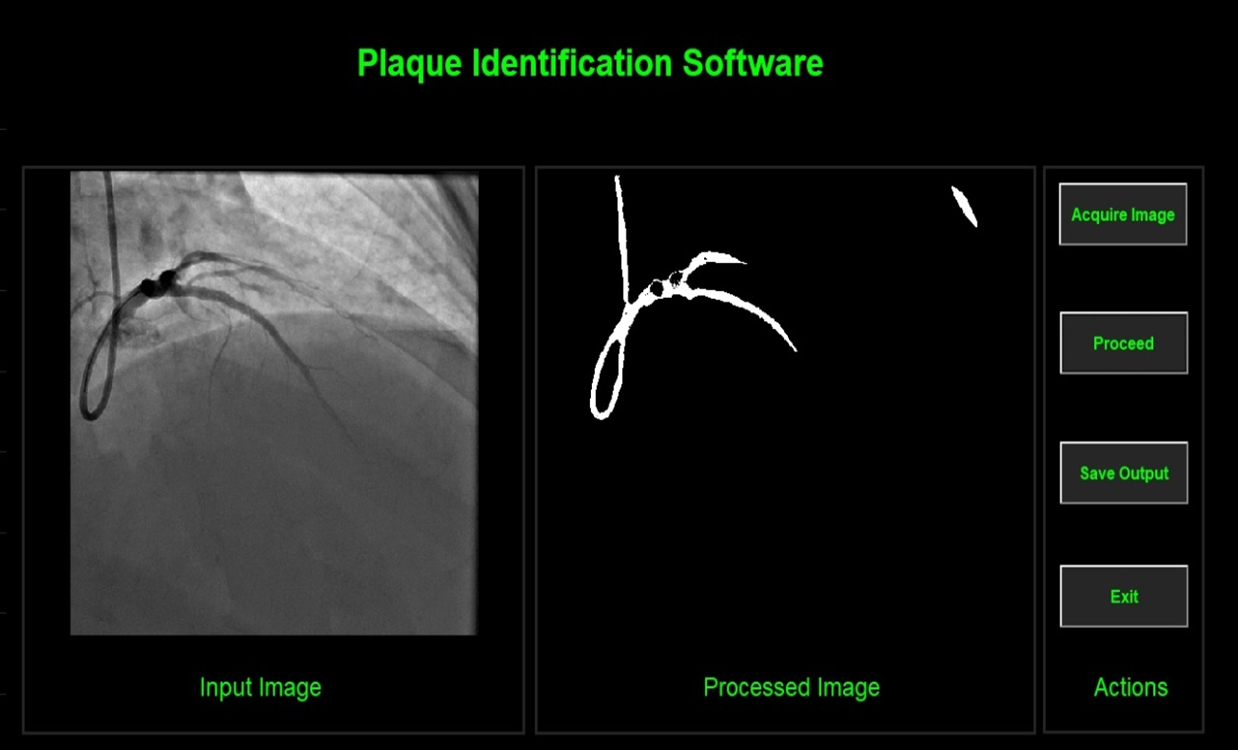
User Interface IV