
EFFICIENT WAY TO DETECT BONE CANCER USING IMAGE SEGMENTATION-in-Matlab-using-Image-Processing-Techniques
EFFICIENT WAY TO DETECT BONE CANCER USING IMAGE SEGMENTATION-in-Matlab-using-Image-Processing-Techniques
Demo ->
Bone Cancer Detection, a GUI-based application in Matlab using Image Processing Techniques.
1. System Design
Proposed and developed solution for bone cancer detection is presented

Main Flowchart of Developed System
1.1 KMeans Algorithm’s Flowchart
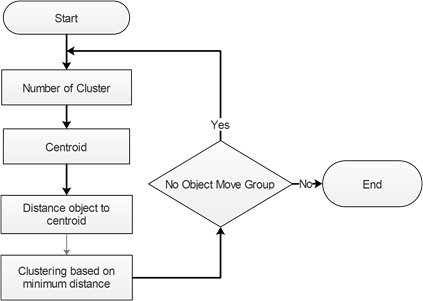
KMeans Algorithm’s Flowchart
1.2 Fuzzy C Means Algorithm’s Flowchart
Fuzzy C Means Algorithm’s Flowchart
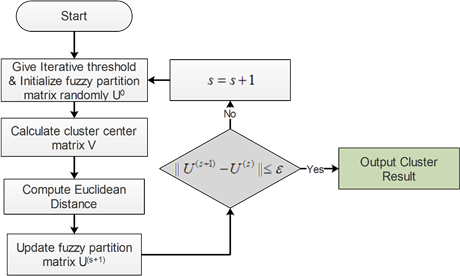
Fuzzy C Means Algorithm’s Flowchart
2. GUI
2.1 Main Page
Main Page
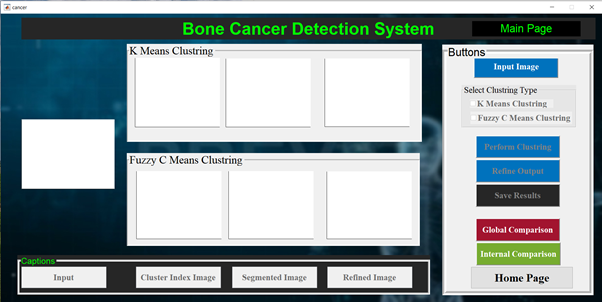
Main Page
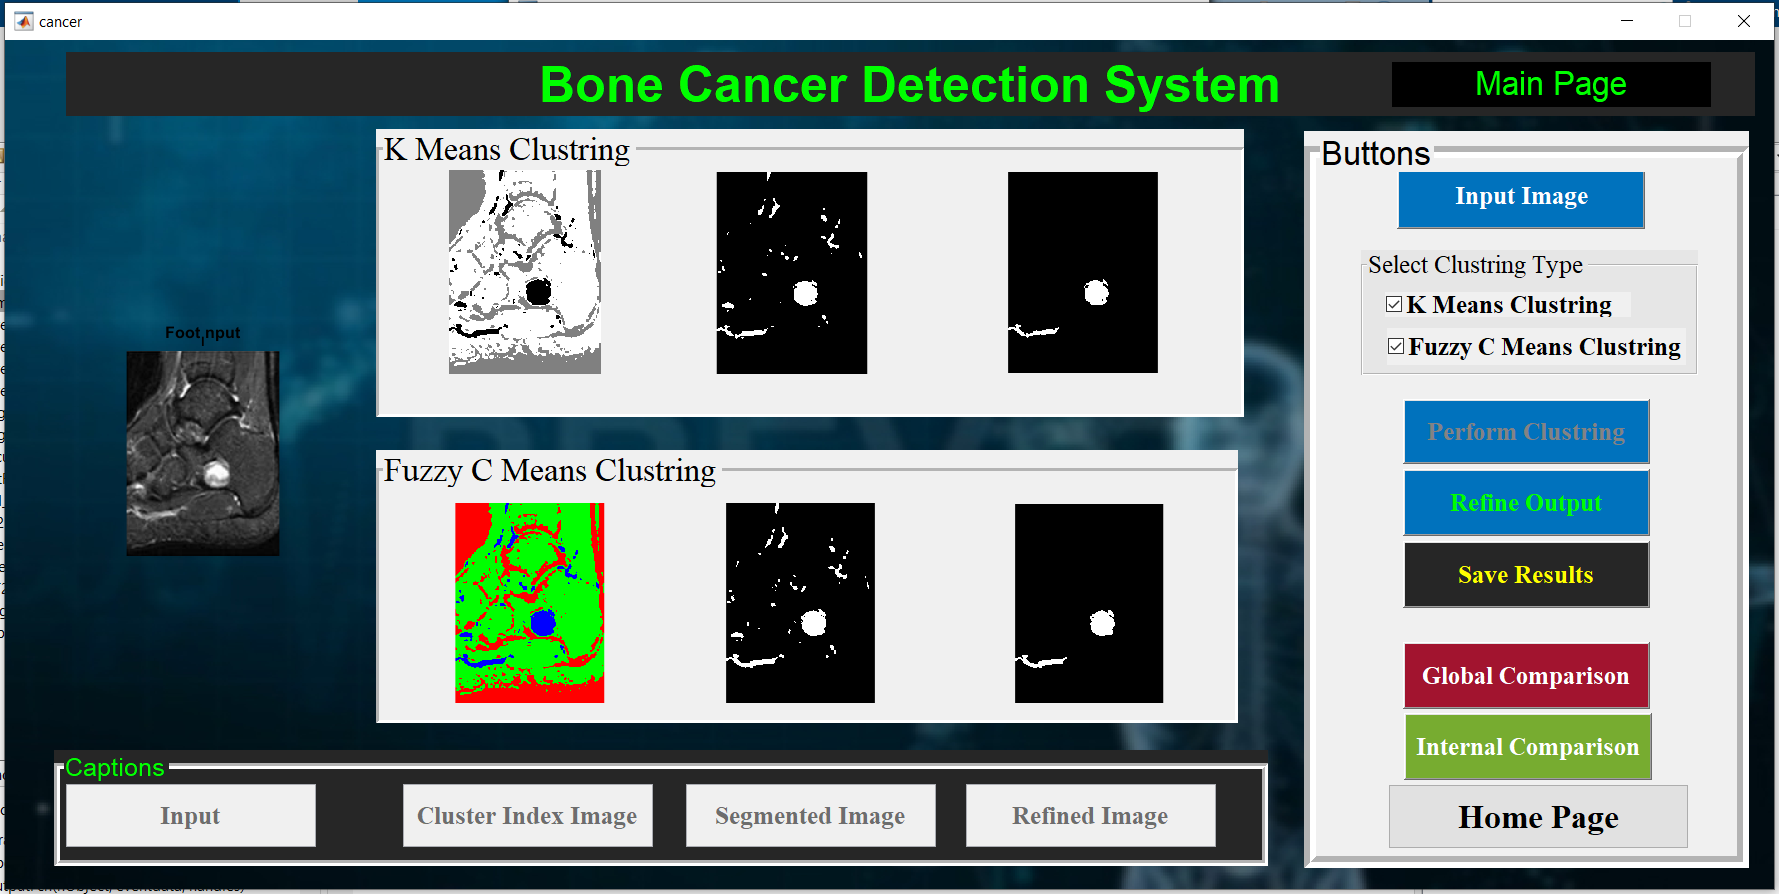
2.2 KMeans Clustering
K Means Clustering
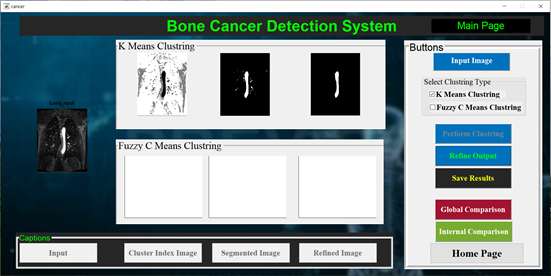
K Means Clustering
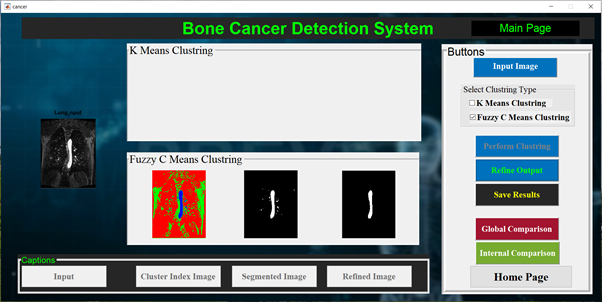
2.3 Fuzzy C Means Clustering
Fuzzy C Means Clustering
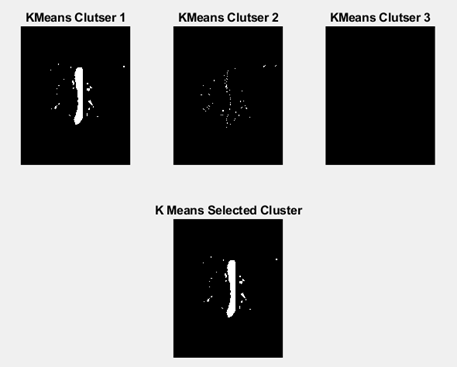
Clusters identified by K Means based on No of Cluster Fuzzy C Means Clustering
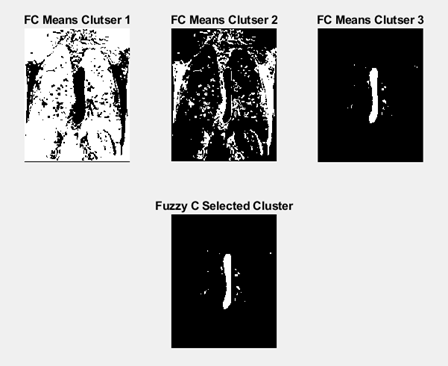
Clusters identified by Fuzzy C Means based on No of Clusters
2.4 Both Algorithms
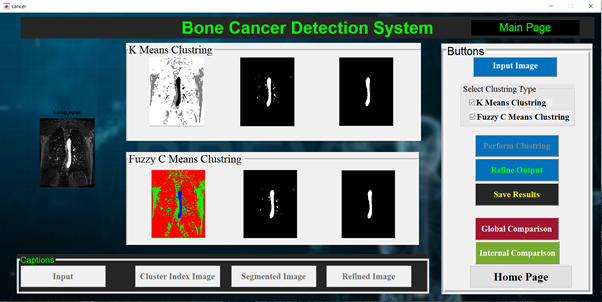
K Means Clustering & Fuzzy C Means Clustering both
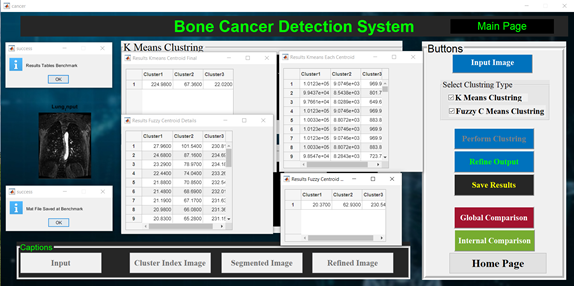
GUI after Save Result Button Clicked
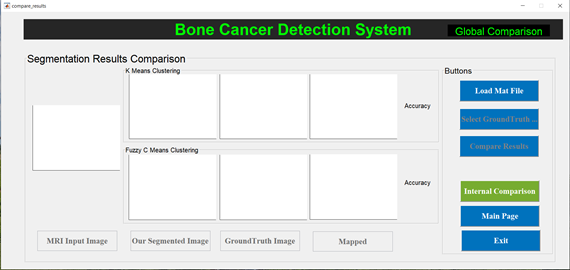
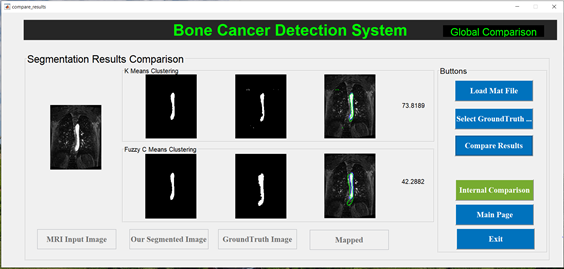
2.5 Global Comparison
2.6 Internal Comparison
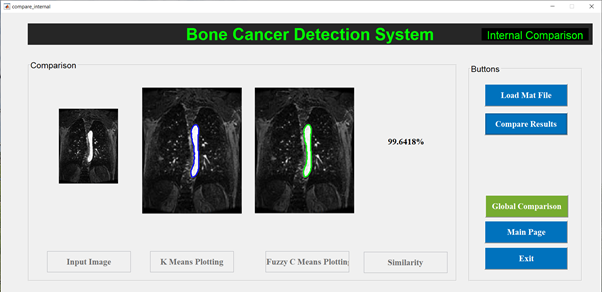
Compare Internal Results GUI after loading mat after Compare Results button is clicked
3. Implementation
3.1 K-Means Clustering
For bone cancer detection, Firstly, we have implemented the K Means clustering algorithm.
- Choose a value of k, number of clusters to be formed.
- Randomly select k data points from the data set as the initial cluster centroids/centres
- For each data point: 3.1. Compute the distance between the data point and the cluster centroid 3.2. Assign the data point to the closest centroid
- For each cluster calculate the new mean based on the data points in the cluster.
- Repeat III & IV steps until mean of the clusters stops changing or maximum number of iterations reached.
3.2 Fuzzy C Means Clustering
Secondly, we have implemented Fuzzy C Means clustering. Let X = {x1, x2, x3 …, xn} be the set of data points and V = {v1, v2, v3 …, vc} be the set of centers.
- Randomly select ‘c’ cluster centers.
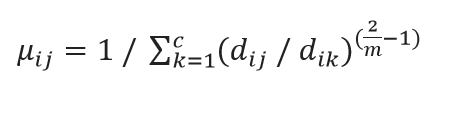
- Calculate the fuzzy membership ‘µij’ using:
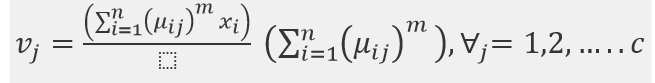
- Compute the fuzzy centres ‘vj’ using
4.Repeat step 2) and 3) until the minimum ‘J’ value is achieved or ||U(k+1) - U(k)|| < β. where ‘k’ is the iteration step. ‘β’ is the termination criterion between [0, 1]. ‘U = (µij)n*c’ is the fuzzy membership matrix. ‘J’ is the objective function
3.3 Selection of Best Cluster
After clustering into ‘x’ number of clusters, we have to select the best cluster based on some criteria. Hence selection algorithm is as below:
i. Calculate the sum of all pixel values for each cluster.
ii. Find maximum sum value from all cluster sum.
iii. Assign best cluster with highest sum value
#Bone #Cancer #Detection #Classification #Matlab #GUI #machinelearning #ComputerVision #ImageProcessing #DeepLearning #Feature #Fusion #Extraction #FYP #Project #DIP #CNN #DCNN #GNN #Alexnet #VGG19 #features #CV #implementation